Nowadays, effective personal financial management has become more important than ever before. With rising interest rates and inflation higher than it has been in decades, achieving your financial goals may seem like a daunting task. However, by understanding the importance of financial management and taking the proper steps, you can create a plan that fits your lifestyle and helps you accomplish your objectives. This beginner’s guide will touch upon the power of setting financial goals and provide a simple roadmap to help you embark on your personal finance journey.
Set Financial Goals
Setting financial goals is a significant part of personal financial management. It provides a clear vision of what you want to achieve and acts as a roadmap to guide your financial decisions. Whether saving for a down payment on a house, planning for retirement, or aiming to pay off debt, having well-defined goals can help you stay focused and motivated.
Creating a Plan You Can Stick To
A successful personal financial plan should be realistic, flexible, and tailored to your unique lifestyle.
To create a plan you can stick to, consider the following steps:
Assess your current financial situation: Understand your income, expenses, assets, and liabilities to get a clear picture of your starting point.
Set SMART goals: Make your personal finance goals Specific, Measurable, Achievable, Relevant, and Time-bound. This ensures that your goals are realistic and attainable.
Develop a budget: Allocate your income towards different categories like savings, investments, and expenses. Prioritize essential expenses and allocate funds to meet your financial goals.
Monitor your progress: Regularly review your financial plan to track your progress and make any necessary adjustments. This will help you stay on track and adapt to any changes in your financial situation.
Overcoming Obstacles Like Higher Interest Rates and Inflation
Higher interest rates and inflation can create challenges when accomplishing your financial goals. However, there are creative ways to overcome these obstacles:
Focus on building an emergency fund: An emergency fund can act as a buffer against unexpected expenses, reducing the need to rely on high-interest debt.
Consider refinancing: If you have existing loans, investigate refinancing options to secure lower interest rates and reduce your overall debt burden.
Cut expenses and increase income: Explore ways to reduce your spending and increase your income to accelerate your progress toward your financial goals.
You Are in Control of Your Financial Future
Smart, consistent, and creative personal financial management is essential for navigating today’s economic landscape. By understanding its importance, setting clear financial goals, and creating a plan tailored to your lifestyle, you can overcome any obstacle and achieve your desired financial success. Remember, the journey to financial wellness begins with a single step, and it’s never too late to take charge of your finances.
One of the most crucial skills every real estate investor should master is calculating Net Operating Income (NOI). As I’ve emphasized in previous articles, real estate investing is fundamentally a numbers game. This is a universal truth that bears repeating. Developing a deep understanding of the financial aspects of property investments is vital for success. Allowing emotions to influence your decisions is a surefire path to disaster. So let’s dive in!
In this article, we will define NOI, explain how it is calculated, provide a high-level example calculation, discuss the importance of NOI in determining cap rate and ultimately property value using the income approach, and compare NOI to EBITDA. As always, we’re providing a FREE downloadable Excel spreadsheet to help you grasp the concept and apply it to your own investments.
What is Net Operating Income (NOI)?
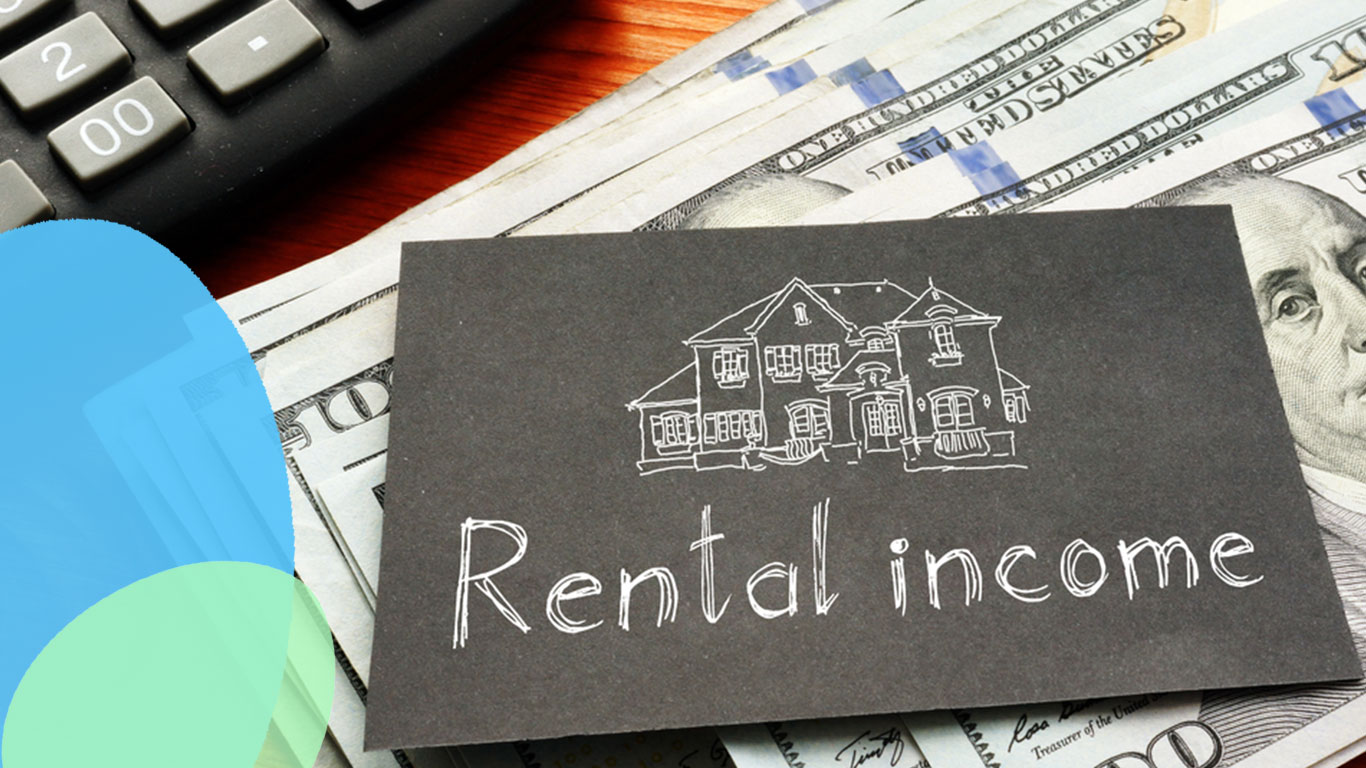
Net Operating Income, or NOI, is the income generated by a property after accounting for operating expenses but before considering financing costs, taxes, and non-cash expenses like depreciation and amortization. NOI is a critical metric for real estate investors because it reflects the property’s ability to generate cash flow from its core operations, helping investors make informed decisions when evaluating potential investments.
Add up the annual operating expenses: $9,000 (property management) + $3,000 (insurance) + $5,000 (repairs and maintenance) = $17,000
Solve for NOI by subtracting the operating expenses from the net effective income: $129,000 – $17,000 = $112,000
In this example, the property’s annual NOI is $112,000.
Here’s the same example calculation as above, but in Excel to help you visualize it all:
Step-by-Step Net Operating Income Calculation Example Using Excel.
NOI’s Role in Cap Rate and Property Valuation
NOI plays a crucial role in determining a property’s capitalization rate (cap rate) and estimating its value using the income approach. While the income approach may be a new term for some, rest assured that we will address the various types of valuation techniques, including the income approach, in a subsequent article.
By accurately calculating NOI, real estate investors can make informed decisions regarding a property’s value and assess its potential return on investment.
NOI and EBITDA: A Comparison
You may be asking yourself, “Self, what is EBITDA?” Good question. EBITDA, which stands for Earnings Before Interest, Taxes, Depreciation, and Amortization, is a financial metric commonly used to evaluate a company’s operating performance. It provides a snapshot of a company’s profitability by measuring earnings before accounting for certain non-operating expenses and non-cash items. EBITDA is often used by investors and analysts to compare the financial health of different companies within the same industry. It can also be used to track a company’s performance over time.
While EBITDA focuses on a company’s operations, it shares some similarities with NOI in the context of real estate investing. Both NOI and EBITDA provide a snapshot of an investment’s profitability before accounting for financing costs, taxes, and non-cash expenses like depreciation and amortization. By focusing on the earning potential of an investment’s core operations, investors can more accurately assess the viability and profitability of the opportunity.
FREE Excel Spreadsheet for NOI Calculation
To help you master the NOI calculation and apply it to your own property investments, we’ve created a FREE Excel spreadsheet for you to download. The spreadsheet includes a step-by-step guide, an example calculation, and a customizable template for your own property analysis. Click the link below to get your copy now!
Net Operating Income (NOI) is a critical financial metric for real estate investors for myriad reasons. By accurately calculating NOI, investors can make informed decisions when comparing potential investments, estimating property values, and determining cap rates.
Use our free Excel spreadsheet to practice your NOI calculations and enhance your real estate investing skills. With a solid understanding of NOI and its implications, you’ll be better equipped to make smart investment decisions and maximize your returns.
Real estate investing is a numbers game, so never let emotions impact your decision-making process. Understanding the financial aspects of property investments is crucial to your success. One important calculation that every investor should be familiar with is Net Effective Income (NEI). In this article, we will break down the components of NEI and explain how to calculate it. As always, we’re providing a FREE downloadable Excel spreadsheet to help you grasp the concept and apply it to your own investments.
What is Net Effective Income (NEI)?
Net Effective Income is the actual income that a property generates after accounting for potential gross income, miscellaneous income, and vacancy expenses. This metric is important because it reveals the true earning potential of a property, allowing investors to make informed decisions when comparing and selecting investment opportunities.
Breaking Down the Components of Net Effective Income
Net Effective Income = Potential Gross Income + Miscellaneous Income – Vacancy Expense – Concessions – Credit Loss
To calculate NEI, you need to understand and account for the following components:
Potential Gross Income (PGI): This is the maximum amount of rental income that a property could generate if it were fully occupied. To calculate PGI, multiply the number of units by the market rental rate per unit.
Miscellaneous Income: This refers to any additional income generated by the property, such as parking fees, vending machine revenue, storage fees, gym memberships, or income from renting roof space for cellular towers. Add these amounts to the PGI to get the Total Gross Income (TGI).
Credit Loss: Credit loss is the income lost due to tenants defaulting on their rent payments or leaving without fulfilling their lease obligations. Like vacancy expenses, it’s essential to be conservative in your credit loss assumptions.
How does the Net Effective Income Calculation Work?
Let’s say you’re evaluating a 10-unit apartment building with a market rental rate of $1,000 per unit per month. The property also generates $200 per month in miscellaneous income from parking fees. Using a 5% vacancy rate, let’s calculate the NEI.
Potential Gross Income (PGI): 10 units x $1,000 per unit = $10,000
Total Gross Income (TGI): PGI + Miscellaneous Income = $10,000 + $200 = $10,200
Vacancy Expense: PGI x 5% = $10,000 x 0.05 = $500
Net Effective Income (NEI): TGI – Vacancy Expense = $10,200 – $500 = $9,700
In this example, the Net Effective Income for the apartment building is $9,700 per month.
Here’s the same example calculation as above, but in Excel to help you visualize it all:
Step-by-Step Cash-on-Cash Calculation Example Using Excel.
Why We Left Out Concessions and Credit Loss
Underwriting concessions and credit loss can be challenging for several reasons, primarily due to the variability and unpredictability of these factors. Concessions often depend on market conditions, competition, and the need to attract or retain tenants. Credit loss, on the other hand, arises from the risk of tenants not paying rent or other income-generating fees, which can be influenced by tenant quality, local economic conditions, and property management practices.
Given the difficulty in accurately predicting these factors and the potential for significant variation between properties, we will not include concessions and credit loss in our example calculation. This decision will simplify the demonstration and allow you to focus on understanding the core components of net effective income without the added complexity of accounting for these less predictable elements.
Don’t worry, in a future article, we’ll talk more about concessions and credit loss to help you understand these tricky parts of real estate investing even better.
Download Our FREE Excel Spreadsheet
To help you master the Net Effective Income calculation, we’ve created a FREE Excel spreadsheet for you to download. The spreadsheet includes a step-by-step guide to demonstrate the calculation of NEI using a real-world scenario. Click the link below to get your copy now!
Real estate investing can be a lucrative endeavor if you understand the right metrics to evaluate when analyzing potential investments. One essential metric that every investor should be familiar with is the cash-on-cash (CoC) return. This financial metric offers valuable insight into the performance of an investment property and can help you make informed decisions when building your real estate portfolio. In this article, we’ll explore the concept of cash-on-cash returns, discuss how to calculate them, and highlight their importance in real estate investment analysis. Don’t worry, as always, we at HappyNest will provide an Excel spreadsheet to guide you through the calculations.
What is Cash-on-Cash Return?
In simple terms, cash-on-cash return helps you understand the cash yield you can anticipate from an investment property based on the money you’ve invested. It calculates the annual cash flow generated by the property before taxes are deducted, and then calculates what percentage that represents of the initial cash investment. This metric is particularly useful for investments involving financing, as it accounts for the impact of debt on the investment.
Generally, higher cash-on-cash returns indicate a more favorable investment, while lower returns suggest a less desirable opportunity.
Cash-on-Cash Return vs. Cap Rate
The Impact of Debt
Before we dive deeper into calculating cash-on-cash returns, it’s important to understand the main difference between cash-on-cash returns and cap rates, another commonly used metric in real estate investing. The key distinction lies in the impact of debt on the investment’s returns.
Positive leverage takes place when the cost of borrowing is lower than the property’s cap rate, leading to a cash-on-cash return that’s greater than the cap rate. Conversely, negative leverage occurs when the cost of borrowing exceeds the cap rate, resulting in a lower cash-on-cash return. It’s essential for investors to understand the relationship between cap rate and cash-on-cash return to effectively assess the impact of financing on their real estate investments. If this sounds confusing, don’t worry, as we will explore debt—commonly referred to as leverage—and the potential influence it has on returns in a future article.
How to Calculate Cash-on-Cash Returns:
To make informed decisions about your investments, you’ll need to know how to calculate cash-on-cash returns. In this section, we’ll provide you with the cash-on-cash return formula and explain the two key components required for the calculation: annual pre-tax cash flow and total initial cash investment.
To calculate cash-on-cash return, follow these steps:
1. Determine the annual pre-tax cash flow: Calculate the annual cash flow of a rental property by first determining the property’s annual rental income. Then, you must subtract the annual operating expenses, such as property management fees, maintenance costs, taxes, and insurance. The resulting number will be your net operating income (NOI). Once you have calculated the NOI, you can subtract the mortgage payments to arrive at the annual cash flow before taxes.
2. Determine the initial cash investment: Calculate the total amount of cash invested in the property, including the down payment, closing costs, and any initial repairs or improvements.
3. Calculate the cash-on-cash return: Divide the annual pre-tax cash flow by the initial cash investment, then multiply the result by 100 to express the cash-on-cash return as a percentage.
Here’s a simple calculation of a cash-on-cash return to help you visualize it all:
Step-by-Step Cash-on-Cash Calculation Example Using Excel.
Why are Cash-on-Cash Returns Important?
Investment Performance: Cash-on-cash return helps investors understand the performance of their investments in terms of cash flow. A higher cash-on-cash return indicates a more profitable investment, while a lower return may signal that the property is not generating sufficient cash flow relative to the initial investment.
Financing Impact: By taking into account the impact of financing, cash-on-cash return allows investors to assess the true cost of their investment and evaluate the effectiveness of leveraging debt to finance their property.
Comparison Tool: Cash-on-cash return provides a standardized metric that investors can use to compare different investment properties, making it easier to identify the most profitable opportunities.
Decision-Making: Grasping cash-on-cash returns helps investors make well-informed choices about investing in a specific property or exploring other investment options. This understanding also aids in making decisions about using debt, refinancing, or tweaking investment strategies to optimize returns.
Breaking Down the Calculation Using A Spreadsheet
To help you better understand the cash-on-cash calculations, we’ve attached an Excel spreadsheet that demonstrates the process step by step. This spreadsheet will serve as a useful reference as you begin evaluating potential real estate investments.
Cash-on-cash return is fundamental for real estate investors to comprehend and calculate, as it offers valuable insight into an investment’s performance and its suitability for your portfolio. By considering the impact of debt on returns, cash-on-cash return presents a more accurate reflection of an investor’s actual return, particularly when financing is involved.
In addition to understanding the relationship between cap rate and cash-on-cash return, truly mastering the calculation and interpretation of cash-on-cash return can significantly enhance your ability to compare various investment options. By incorporating this calculation into your investment analysis toolkit, you’ll be better prepared to make informed decisions that maximize your real estate investment returns.
Remember, knowledge is power when it comes to real estate investing. Continuously refining your understanding of key metrics like cash-on-cash returns will help you make the most of your investments and build long-term wealth in the world of real estate. Happy investing!
About the Author
Jesse Prince, a combat veteran, CEO of HappyNest, and a seasoned commercial real estate entrepreneur, is passionate about making real estate investing accessible to everyone. With the innovative HappyNest investment app, Jesse empowers investors of all budgets to grow their nest eggs through quality real estate investments. Jesse’s expertise spans various aspects of real estate, including acquisitions, asset and property management, valuation, credit analysis, and real estate securities evaluation.
If you’re a beginner in real estate finance, one of the most essential concepts you need to grasp is the capitalization rate, commonly known as the cap rate. Cap rates are a critical metric used by real estate investors and industry professionals to evaluate the potential return on investment (ROI) and the relative risk of a real estate property. As an NYU-educated expert in real estate finance and the founder of HappyNest, I’m here to break down this concept and help you understand cap rates and their significance in your investment journey. Don’t worry, we’ll also provide an attached Excel spreadsheet to guide you through the calculations.
What is a Cap Rate?
The cap rate is a ratio that compares a property’s net operating income (NOI) to its purchase price or market value. It is widely used in commercial real estate to estimate the potential return on investment for a property, without considering the effects of financing. That means that the cap rate would be your estimated return if you bought the property outright with cash (also known as equity). Essentially, the cap rate allows you to assess the risk and return of a property relative to its price.
Calculating the Cap Rate:
To make informed decisions about your investments, you’ll need to know how to calculate cap rates. In this section, we’ll provide you with the cap rate formula and explain the two key components required for the calculation: Net Operating Income (NOI) and property purchase price or market value.
Cap Rate = Net Operating Income (NOI) / Property Purchase Price or Market Value
To calculate the cap rate, you’ll need two key pieces of information:
Net Operating Income (NOI): The NOI is the annual income generated by the property after accounting for all operating expenses, such as property management fees, maintenance costs, taxes, and insurance. It does not include any mortgage payments or financing costs.
Property Purchase Price or Market Value: This is the price at which the property was purchased or its current market value.
Once you have these numbers, simply divide the NOI by the purchase price or market value to determine the cap rate. Voilà, you’ve now solved for a cap rate!
Here’s a quick example of calculating a cap rate to help you visualize it all:
Step-by-Step Cap Rate Calculation Example Using Excel.
How can investors use cap rates to compare various property investment options?
As a real estate investor, it’s essential to have a solid understanding of cap rates to compare different investment opportunities effectively. In this section, we’ll discuss how you can use cap rates to make informed decisions when evaluating different property investment options.
1. Comparing Properties in the Same Market:
Cap rates can be instrumental in comparing similar properties within the same market. By calculating the cap rate for each property, you can quickly determine which one offers a better potential return on investment (ROI) relative to its price. For example, a property with a cap rate of 6% may be more attractive than one with a cap rate of 4% because it offers a higher potential return for the same level of risk.
2. Evaluating Market Trends and Conditions:
You can use cap rates to analyze market trends and conditions by comparing the average cap rates for different property types or locations. This comparison can help you identify areas with higher potential returns or markets that may be undervalued. Keep in mind that various factors, such as local economic conditions and property demand, can influence cap rates. Therefore, it’s crucial to consider these factors alongside the cap rate when making investment decisions.
3. Assessing Risk Profile:
Cap rates can also help you assess the risk profile of a property. Generally, a higher cap rate signifies a higher level of risk, while a lower cap rate indicates lower risk.
For example, a property in a prime location with high demand and low vacancies might have a lower cap rate than a property in a less desirable area with higher vacancies.
By comparing cap rates, you can evaluate the risk associated with each property and choose the one that aligns best with your investment goals and risk tolerance.
4. Determining the Feasibility of an Investment:
Lastly, cap rates can help you determine whether an investment is worth pursuing. If the cap rate is lower than your required rate of return, it may not be a suitable investment. Conversely, if the cap rate is higher than your required rate of return, the property could be a potential candidate for your investment portfolio. This evaluation can save you time and effort by allowing you to focus on opportunities that meet your investment criteria.
Breaking Down the Calculation Using A Spreadsheet
To help you better understand the cap rate calculations, we’ve attached an Excel spreadsheet that demonstrates the process step by step. This spreadsheet will serve as a useful reference as you begin evaluating potential real estate investments.
Cap Rates Unlock the Door to Smart Real Estate Investments
As a beginner in real estate finance, understanding cap rates is crucial to making informed investment decisions. By grasping the concept and its applications, you’ll be better equipped to assess potential investments and develop a successful real estate portfolio of your own. As you gain more experience and knowledge in the field, you’ll find cap rates to be an invaluable tool in your real estate finance arsenal.
It’s essential to note that cap rates are just one tool in your real estate finance toolkit. Cap rates should not be the sole basis for your investment decisions but rather used in conjunction with other valuation methods and market research. Remember, practice makes perfect – so keep honing your skills, and soon, you’ll be a cap rate expert!
About the Author
Jesse Prince, a combat veteran, CEO of HappyNest, and a seasoned commercial real estate entrepreneur, is passionate about making real estate investing accessible to everyone. With the innovative HappyNest investment app, Jesse empowers investors of all budgets to grow their nest eggs through quality real estate investments. Jesse’s expertise spans various aspects of real estate, including acquisitions, asset and property management, valuation, credit analysis, and real estate securities evaluation.
In today’s fast-paced and ever-changing world, real estate has always been a cornerstone of investment for many individuals. With the advent of new technologies and innovative business models, the landscape of real estate investing is rapidly evolving. In this exclusive interview, we sit down with Jesse Prince, the CEO of HappyNest, a groundbreaking platform that is revolutionizing the commercial real estate investment industry. Jesse shares his vision for the future of real estate investing and how HappyNest is paving the way.
Jesse has always been passionate about real estate investing. With a background in finance, a master’s in real estate from NYU, and years of experience in the industry, he noticed a significant gap in the market – a lack of accessible, user-friendly platforms for everyday investors. Driven by his passion for real estate and a desire to democratize the investment process, he founded HappyNest, a platform that makes investing in real estate as easy as investing in stocks.
What is HappyNest?
“HappyNest is a fintech startup that offers commercial real estate investment opportunities to retail investors, with a focus on millennials and Gen Z. The platform allows users to invest in real estate funds with as little as $10 and offers unique features like a round-up program that lets users invest their daily transaction round-ups into shares of the fund. HappyNest’s mission is to make real estate investment accessible and inclusive for all while providing a seamless and user-friendly investment experience,” says Prince.
Historically, commercial real estate investments were only accessible to those who could afford to purchase properties independently. Traditional real estate investments necessitate a down payment or a significant lump sum, making it difficult for young or new investors to enter the market. However, commercial real estate assets have outperformed the stock market for decades. HappyNest provides a solution to this problem by offering investors an opportunity to access this lucrative market. As a shareholder, you become a partial landlord of these exceptional assets, and you will receive quarterly dividends from rental income. Furthermore, shareholders will benefit from any increase in value our properties experience.
The future of commercial real estate investing
According to Jesse, “The future of real estate investing lies in making the process more accessible and empowering individual investors.” He envisions a world where technology and data-driven insights enable investors to make well-informed decisions about their investments. In this future, barriers to entry will be significantly reduced, allowing people from all walks of life to participate in real estate investing and build wealth.
Jesse also believes that sustainability and social impact will play a crucial role in the future of real estate. As the industry evolves, he sees a greater emphasis on environmentally friendly and socially responsible investment opportunities. HappyNest is already working towards this vision by carefully selecting properties that adhere to high sustainability standards and support community development initiatives.
How does HappyNest help me become a commercial real estate investor?
With HappyNest, you can become a real estate investor with a low buy-in amount of just $10. It is one of the lowest minimum investments of any real estate investing platform on the market.
HappyNest’s investment portfolio consists of a diverse range of real estate assets, including net leased retail to national tenants, mixed-use properties, multi-family developments, real estate lending funds, logistics facilities, and properties leased to tenants in the cannabis industry. The investments are located across the United States, with a focus on strong logistics locations, growing populations, and thriving industry sectors.
HappyNest’s investment strategy seeks to provide principal protection while achieving attractive returns through a variety of strategies, including property value growth, rent growth, and effective asset management. HappyNest’s recent sale of a CVS property with a 15% IRR in just over two years is a testament to the effectiveness of its investment strategy. Overall, HappyNest’s portfolio offers a unique and well-rounded investment opportunity for those seeking low volatility returns, current income, and downside principal protection in the real estate industry.
Our easy-to-read blog provides useful explanations of investment strategies, allowing users to invest in premier commercial real estate for just a few dollars at a time.
How to get started investing in commercial real estate with HappyNest
HappyNest is undoubtedly at the forefront of the future of real estate investing. With its innovative platform, dedication to accessibility, and commitment to sustainability and social impact, the company is poised to make a lasting impact on the industry. Download our app and start your journey to financial success. Set realistic savings goals, choose the amount you want to invest, and start growing your nest egg.